System Alerts
The System Alerts – 24 Hours charts the total number of generated alerts within the last 24 hours. The chart uses a rolling window format. The most recent count of alerts is generated at the right edge of the chart and older data is moved to the left until any data beyond 24 hours is deleted from the chart.
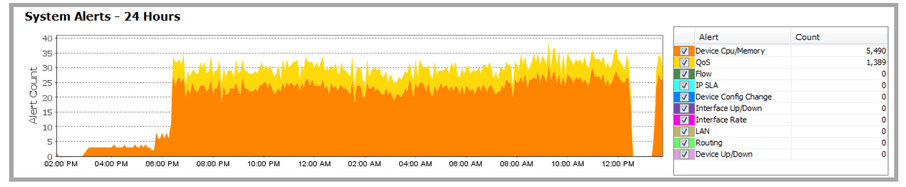
The legend to the right of the System Alerts chart is a tabular summary of the total generated alerts for the chart duration. Use the check box alongside each alert type to enable or disable viewing the alert category from the chart.
The charts and tables below the System Alerts graph provide real-time average data for the dashboard time duration selected. Four-time durations are available: last 15 minutes, last 30 minutes, last 1 hour and last 4 hours. Default is last 15 minutes.